
No-one, especially your management or board, wants to read pages and pages of text in a wildlife hazard management report. If you make your data visually appealing – whether that is data about strike numbers, or species commonly struck at your site, or the seasonal movements of these common strike species, etc., you can make it tell a story, translating this critical aviation safety data to be more accessible, even to a non-aviation audience.
Alexandra Stone, Avisure senior wildlife biologist, emphasises the value of data visualisation in reporting wildlife hazard data, and says, ‘If your organisation is moving from a paper-based, or spreadsheet system to electronic data collection, you might like to consider including a data visualisation program in that transition. As technology becomes more sophisticated, aviation software such as Noggin, TrackerAIRSIDE and AVCRM, can integrate with data visualisation software platforms.’
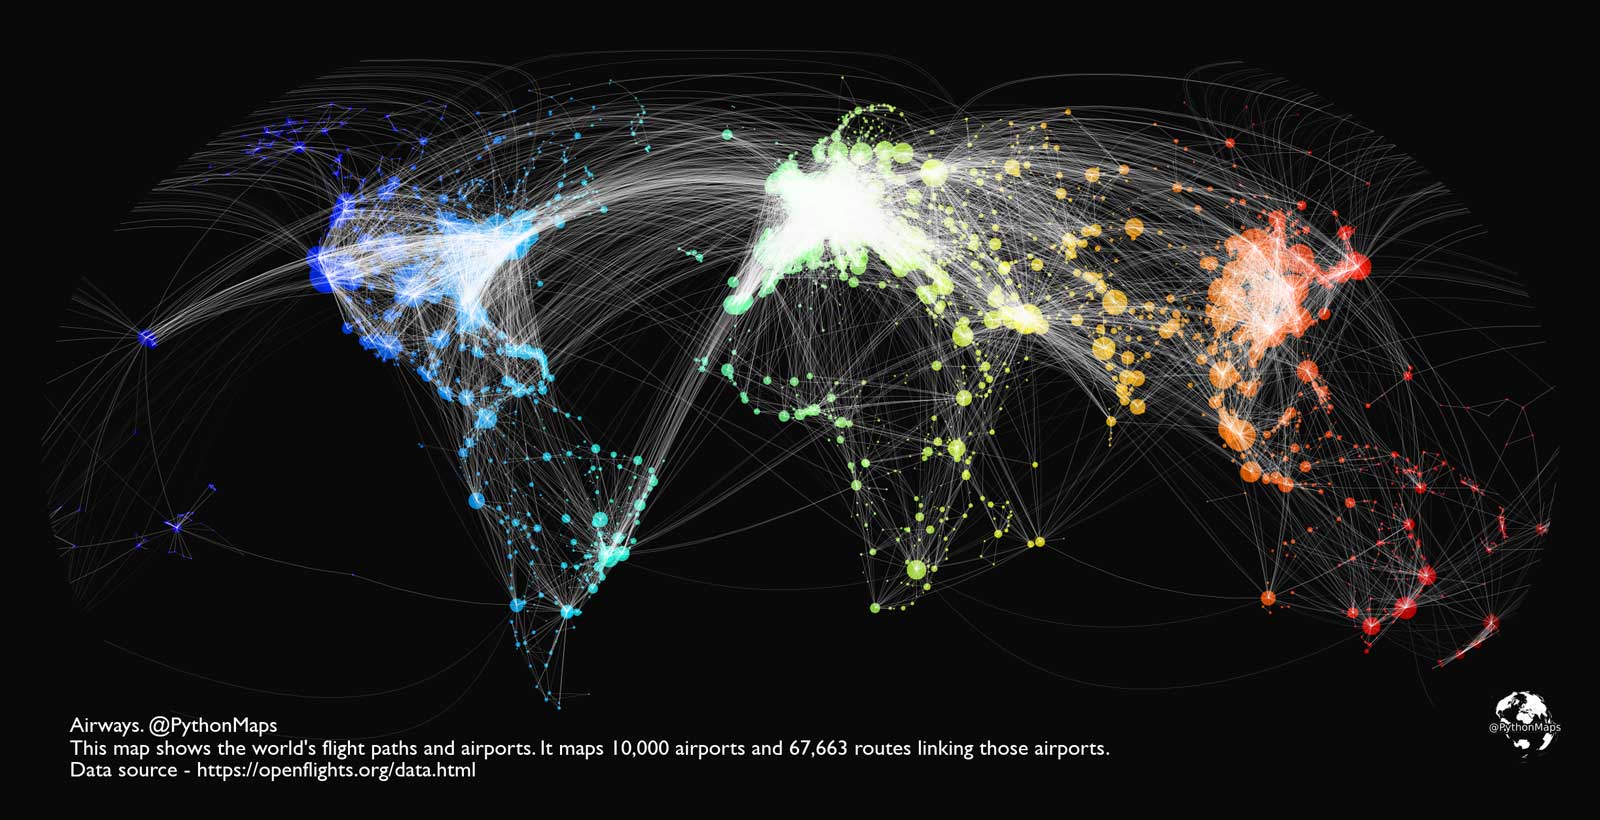
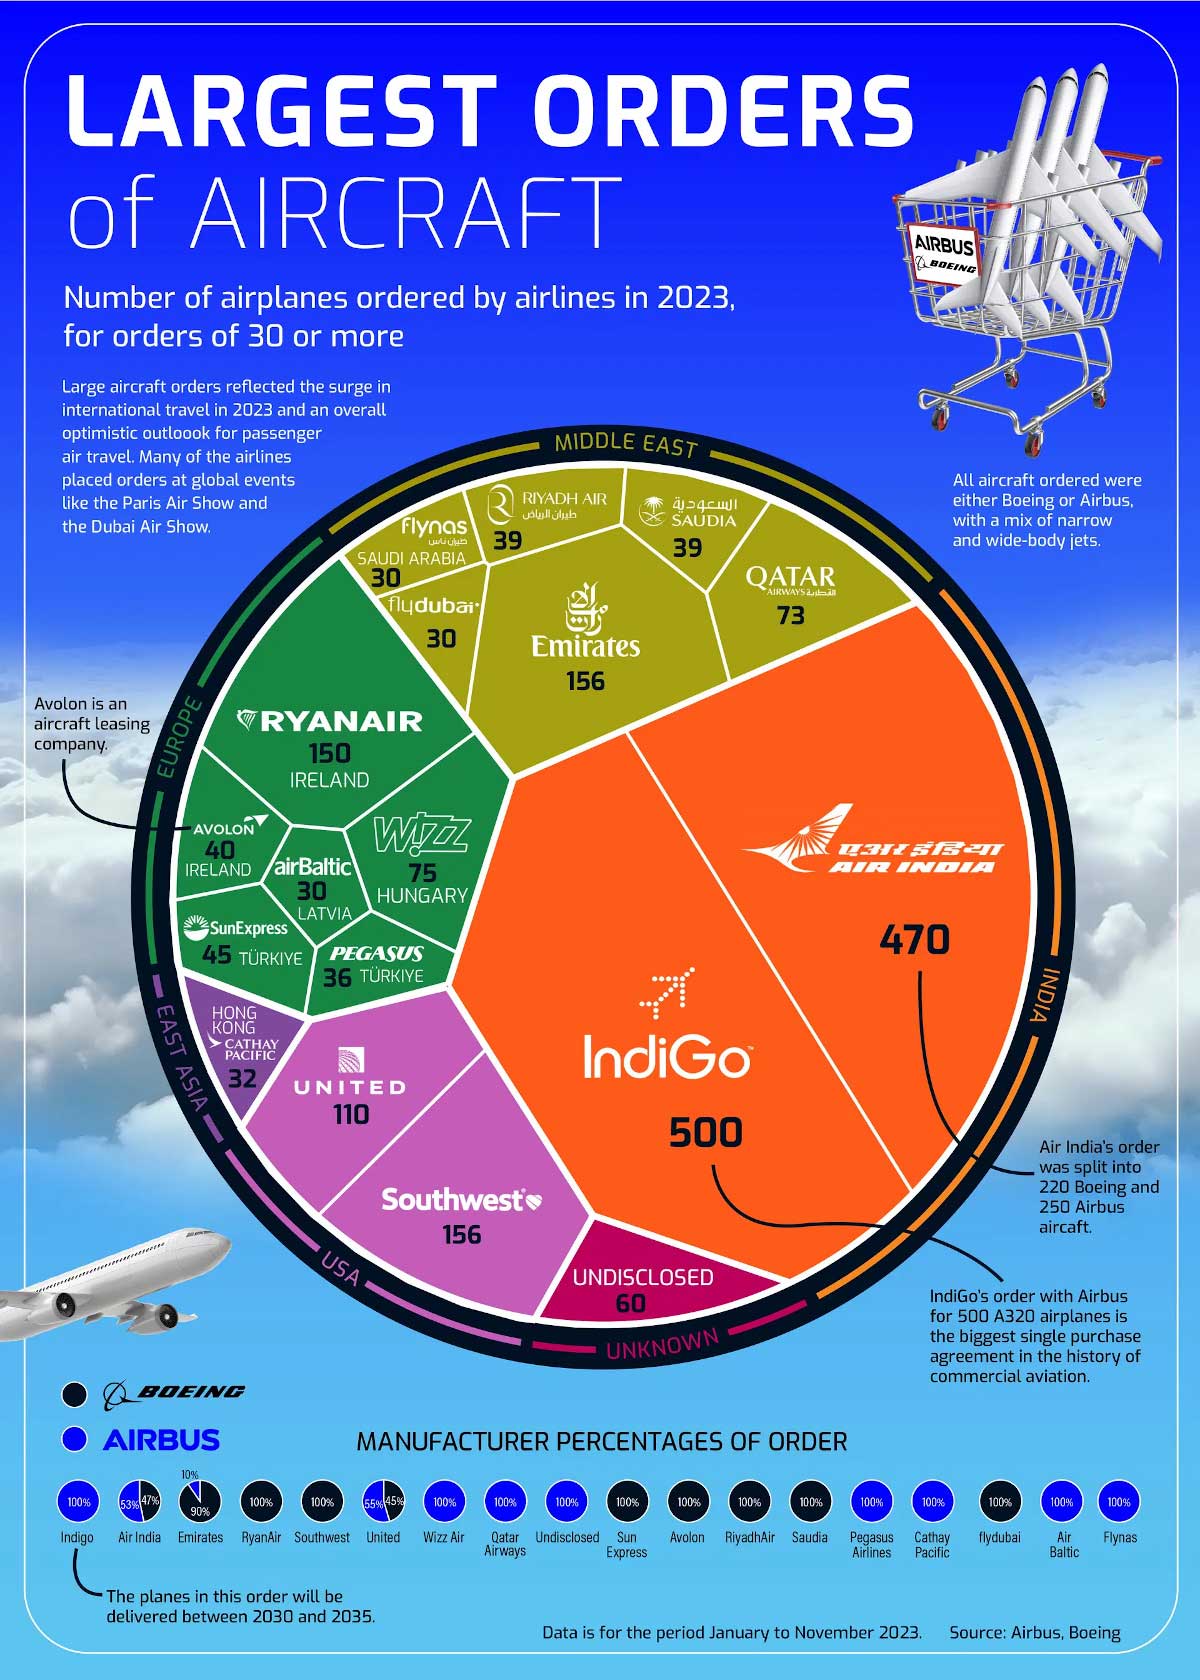
Great examples of using big data visually
However, she cautions, before going down the data visualisation software path, there are several things to consider. ‘Have you worked out exactly what you need to know? Do you still need to record all the fields you used in the old data sheets? Are you asking the right questions?’
Is your data clean from the start? That is one of the most important things to get right, Alexandra says, making sure your terminology is correct at the beginning. Having multiple entries for the same species; for example, ‘Australian white ibis’, ‘ibis’ and ‘white ibis’ is a big no-no. When it comes to data analysis and visualising that data, ‘it is a case of rubbish in, rubbish out’, she says.
‘Above all, do your trials and tests, and try before you buy. Take advantage of the free trial several visualisation programs offer, and make sure it works with your system.’

