(Big) data visualisation
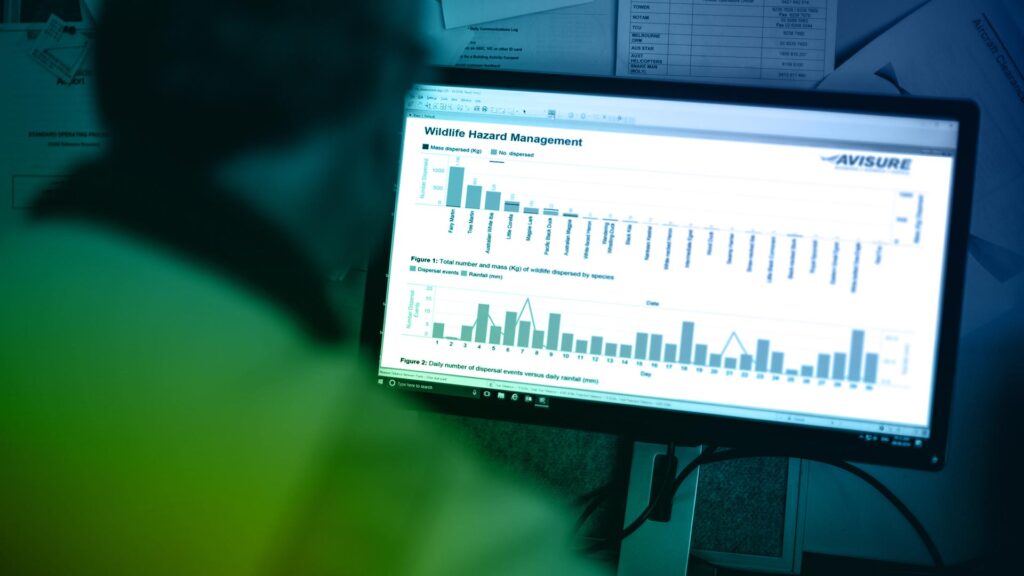
The title may sound scary, but data visualisation is a way of making the complex simple: in a nutshell, it is the art of presenting data and information as graphs, charts, or maps. Data visualisation is valuable in highlighting things that you might not otherwise see readily in text and lists of values and numbers, enabling your audience to grasp the key data more quickly and easily.


